Introduction and background
Since its discovery and invention in 1902 by Willem Einthoven, the electrocardiogram (ECG or EKG) has become the main staple of any diagnostic procedure in hospitals, whether the suspected diagnosis is directly related to cardiac symptoms or whether other symptoms may be at play. The main benefit of the ECG is that it enables non-invasive recording of the electrical activity of the heart and visualizing or storing the heart’s beats in a format that can be read and interpreted by trained physicians.
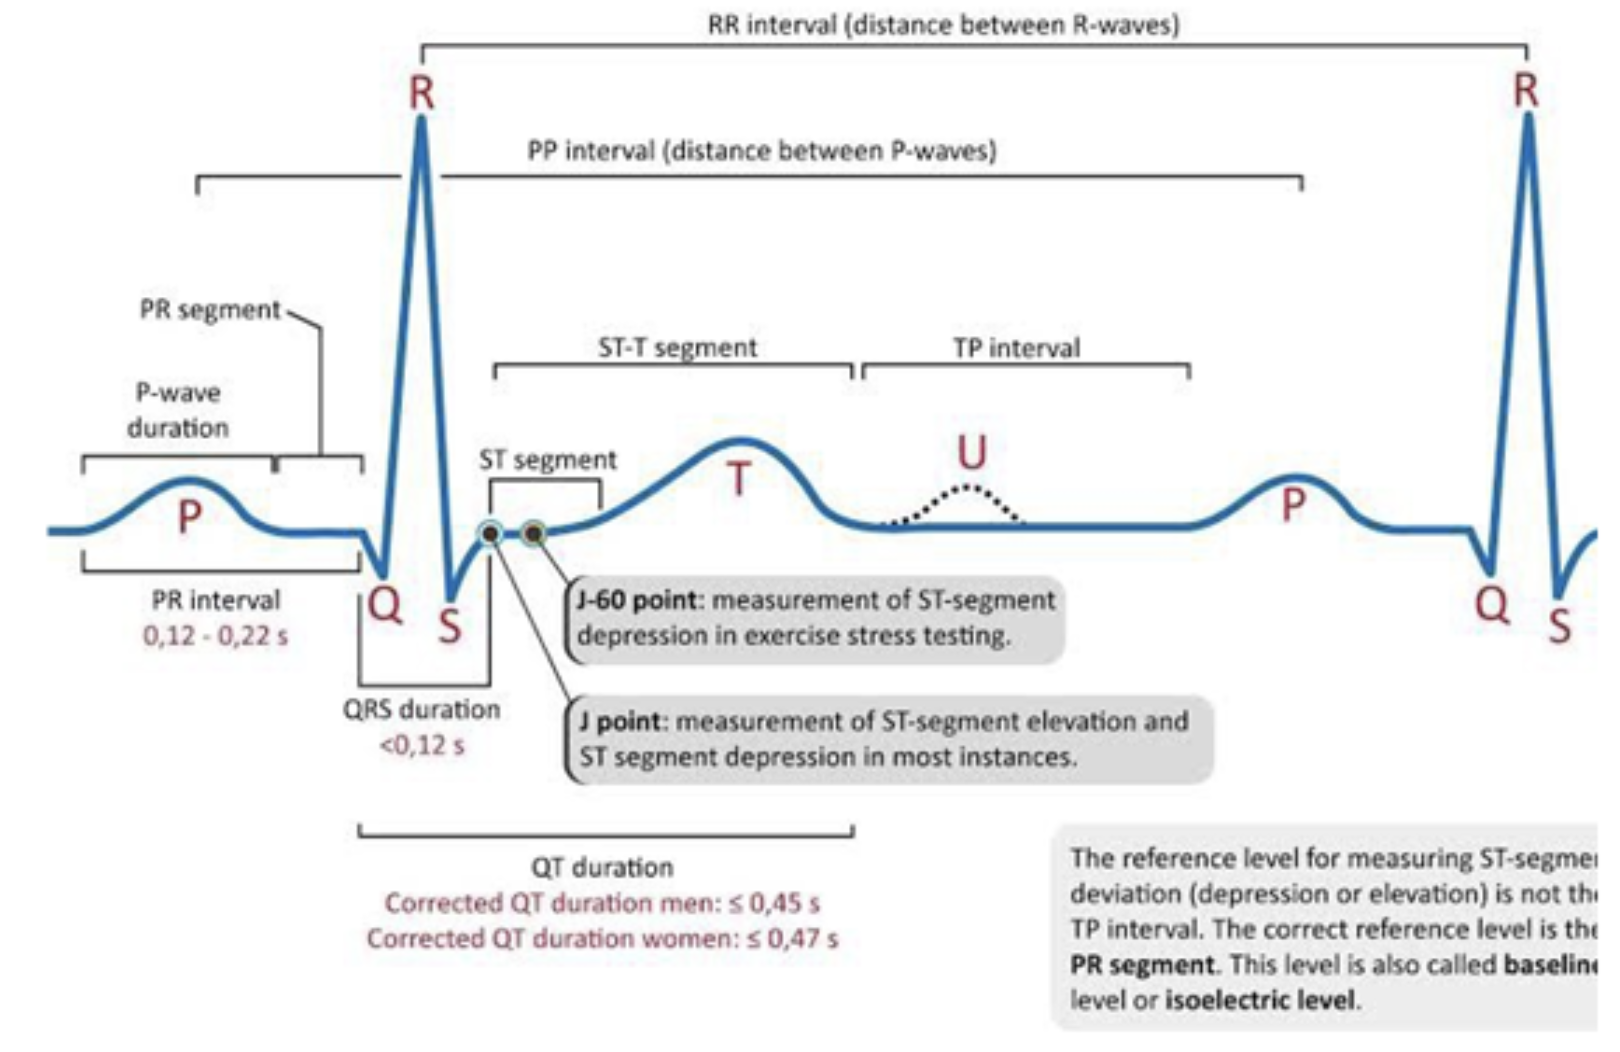
Fig. 6 Figure 13. Stylized representation of the ECG’s PQRST(U) complex. Figure from https://ecgwaves.com/topic/ecg-normal-p-wave-qrs-complex-st-segment-t-wave-j-point
The interpretation is based on recognizing the various components of the so called PQRST complex that comprises a single heartbeat. The PQRST complex has been called as such ever since Einthoven’s description of the ECG signal. The sequence of waves is directly related to polarization and depolarization of the various structural parts of the heart and their role and position in the sequence of a single heartbeat. For instance, the R-wave is the largest because it represents the depolarization of all ventricles. Given its size it is easiest to detect and is typically used to determine the interbeat interval (the time between beats as visualized by the RR interval in Figure 13) which in turn is used to compute heart rate as the number of beats per minute.
Although the general public typically only knows about the typical ECG shape as visualized in Figure 13, clinicians actually (typically) use 12 individual leads (ECG sensors) and track the progression of a specific wave over time across the leads to glean more information to support their diagnostic purpose. For instance, changes in the deflection of the P-wave on leads II and V1 are known to be indicative of hypertrophy.
Bias in ECG
That such relations between (changes in) ECG deflections and symptoms exist for many people is largely due to the DNA homogeneity of the human population: It has been estimated that only 0.1% of our DNA varies [1]. Despite that homogeneity, it has been observed that ECG morphology, for instance aspects like the duration and voltage of the QRS complex, varies between different ethnic populations [2],[3]_. Similarly, there is evidence that ECG abnormalities vary between ethnic populations. For instance, in the US it was observed that people with European ancestry have a higher prevalence of atrial fibrillation [4] despite having lower risk factors than underrepresented ethnic groups [5].
Thus, on the one hand, the ECG and symptoms have large commonality over the human population but the ability to algorithmically detect deviations from the norm for certain subpopulations depends, on the other hand, on the availability of such data to train such an algorithm. This applies for the monitoring of ECG to detect these deviations from the norm as well as for diagnostic purposes where algorithms support clinicians in their diagnosis. This situation may result in bias in the monitoring or diagnostic algorithms.
For instance, it is known that between the genders, considerable differences in cardiac disease exist: women have higher mortality, more symptoms, and higher rates of recurrence after ablation procedures against atrial fibrillation. Women present differently compared to men when suffering from myocardial infarction, and their bodies react to and process medication differently than males do [6]. When (AI) algorithms are trained on data that, for the majority, is based on measurements on males, such an algorithm may not respond properly to ECG data from women.
Similarly, with the physiological changes in the body due to ageing, it is known that ECG signals are different between the younger and older population [7] but there is a paucity of data from the younger population with a potential effect of biasing AI against younger people. Similar reasoning applies for comorbidities that have been shown to affect the ECG signal to some degree [8]: It is difficult to capture a sufficient amount of data for all possible combinations of comorbidities and symptomatic ECG traces.
It is therefore important that (AI) algorithms for monitoring of running ECG and/or diagnosis of symptomatic ECG need to be trained on well-balanced data set ensuring fair and biasfree performance for all intended larger and smaller populations of hospital patients. For that reason, it is important for developers of algorithms for scoring and classifying ECG signals to have a diversity of data available to ensure that their algorithms can be readily used in a diverse range of scenarios without compromising on the efficacy of the algorithm to determine the correct outcome.
Synthetic ECG
One way to deal with bias and unbalance in data is to use synthetic data to complement or replace the original data. For ECG, typically, one of three approaches is used: mathematical modeling, computer-vision techniques, or deep-learning approaches [9]. For this use case, we have developed a confidential algorithm to generate synthetic ECG traces to support the development of AI algorithms for ECG classification in all aspects. The ECG signal generator can create healthy/normal ECGs for multiple leads and add noise to the signal from a diverse range of sources to represent real-life scenarios involving faulty or misplaced ECG leads. Beyond the normal ECGs, the algorithm can also generate symptomatic ECGs with specific configurations to create signals with a range of type and severity of the symptoms. A sample of these synthetic ECGs has been made available to interested parties in the AEQUITAS consortium for further analysis.
Fair-by-Design – Fair Output Interpretation Methodology
Methodology Overview
The assessment followed the Fair Output Interpretation Methodology (FOIM), which is grounded in EU AI Act’s Article 14 “Human Oversight”. The aim of FOIM is to have an interdisciplinary and a multi-stakeholder group assess the fairness of the AI system’s outputs within the context it will be used in. FOIM assists AI users and/or deployers in critically assessing the outputs of AI systems before actual deployment to ensure fair implementation. Given that AI systems are developed in diverse environments with various tasks in mind, it is paramount to address the technical, ethical, legal, and social constraints to fairness in AI model outputs.
This methodology was tested in a workshop using the AEQUITAS use case of bias-aware prediction of ICU healthcare outcomes [10]. The AI system predicts in-hospital mortality and ICU length of stay based on continuously monitored patient data, producing a score that informs clinical decision-making. The MIMIC-III dataset comprised over 53,000 ICU admissions from a Boston hospital between 2001 and 2012. As the system has not yet been developed, the workshop used fictional scenarios based on assumed inputs and outputs. Participants evaluated these hypothetical cases to identify potentially biased outcomes, mirroring the kind of human oversight required in real clinical settings. The full report findings can be found in Appendix E.1.
Key Findings
Purpose identification
The AI use case was found to be a single and predictive purpose AI system, with the intended purposes of informing decisions, calculating a score, and ranking within the context of mortality and ICU stay for critical patients.
Data Source & Representation
The MIMIC-III dataset was found to be unfit for the intended EU context due to its U.S. origin, limited ethnic representation, and healthcare-specific biases (e.g. practices linked to insurance incentives). These issues raised concerns about data representativeness and the risk of discriminatory outcomes if left unaddressed.
Outcome evaluation
To assess the success of the system’s outcomes, participants recommended evaluating its impact on diverse population groups. They proposed using a matrix that integrates social, legal, and medical perspectives into outcome evaluation. Trust by doctors was suggested as a possible success indicator, though it could be subjective. Transparency and user agency were also emphasized. Furthermore, when assessing whether historical or other forms of bias had been identified and addressed in the system’s design, it was found that historical biases had not been considered. Participants also flagged the absence of control features (e.g. a ‘stop’ function), concluding that deployment would be premature without these safeguards in place.
Assessment of FOIM
The methodology was effective in assessing output fairness and aligned well with Article 14 of the EU AI Act, though several sections require clearer phrasing and refinement. Questions on Mode Confusion Bias were difficult to answer and should be further clarified. he Dunning-Kruger section raised concerns about sensitivity and potential defensiveness among doctors, suggesting a need for more careful wording to maintain engagement. Furthermore, clarification on Question 2 in terms of which experts were consulted could yield more insight into output interpretation.
Integration into the experimentation environment
nitial versions of the ECG generator were based on a data set from the Physionet database called the incart data [11]. This a data set from 32 patients of which 12-lead ECGs were recorded and the ECGs were annotated with markers of the disease(s) that the patients were diagnosed with. In addition to diagnosis, the data set also contains age and gender for each of the patients.
This is a relatively limited data set compared to the more expansive ones that were tackled in other use cases so we will use this data set as toy example to show case how the bias detection and mitigation cycle could be implemented using synthetic data to repair observed bias. Note that in this analysis bias might be observed simply due to the paucity of data. Also note that the actual synthetic ECG is not used in these analyses because they do not contain demographic data.
Method & data
Data processing
The incart database [11] comprises 30 minute 12-lead ECGs of 75 patients. Of the patients, additionally, age and gender are known as is/are their diagnosis/diagnoses. A limited number of patients has multiple diagnoses. In the ECG, symptomatic beats are tagged by time stamps that are listed in the various files that comprise the database. All processing and analyses are documented and can be reproduced from a dedicated code repository [12].
Before the bias detection and mitigation described below, we first processed the demographic information in the database into a suitable format. That implied first converting exact age in years to 10-year age bins. We opted for 10-year age bins to gain a higher number of patients in each bin. Next, we uncollapsed the multiple diagnoses for some of the patients into separate rows.
For illustration purposes, we feature engineered one additional variable by combing gender and diagnosis into one variable. This facilitated visualizing disparate impact as a result of the interaction between gender and diagnosis. This variable was called gxd.
Finally, we presumed that this data set described the full toy world. That is, we presumed that all observed diagnoses in the data covered all possible diagnoses and, thus, that the absence of diagnosis for a particular patient implied a negative diagnosis. This enabled us to create a column for the presence or absence of a diagnosis which is necessary for bias detection.
Overview of dataset
To get a high-level overview of the data set, we drew histograms for age and gender. This showed that most patients were between 50 and 70 years old (see Figure 14). Note that no pediatric patients were part of the data set: the lowest age bin comprises two 18 and two 19 year old patients.
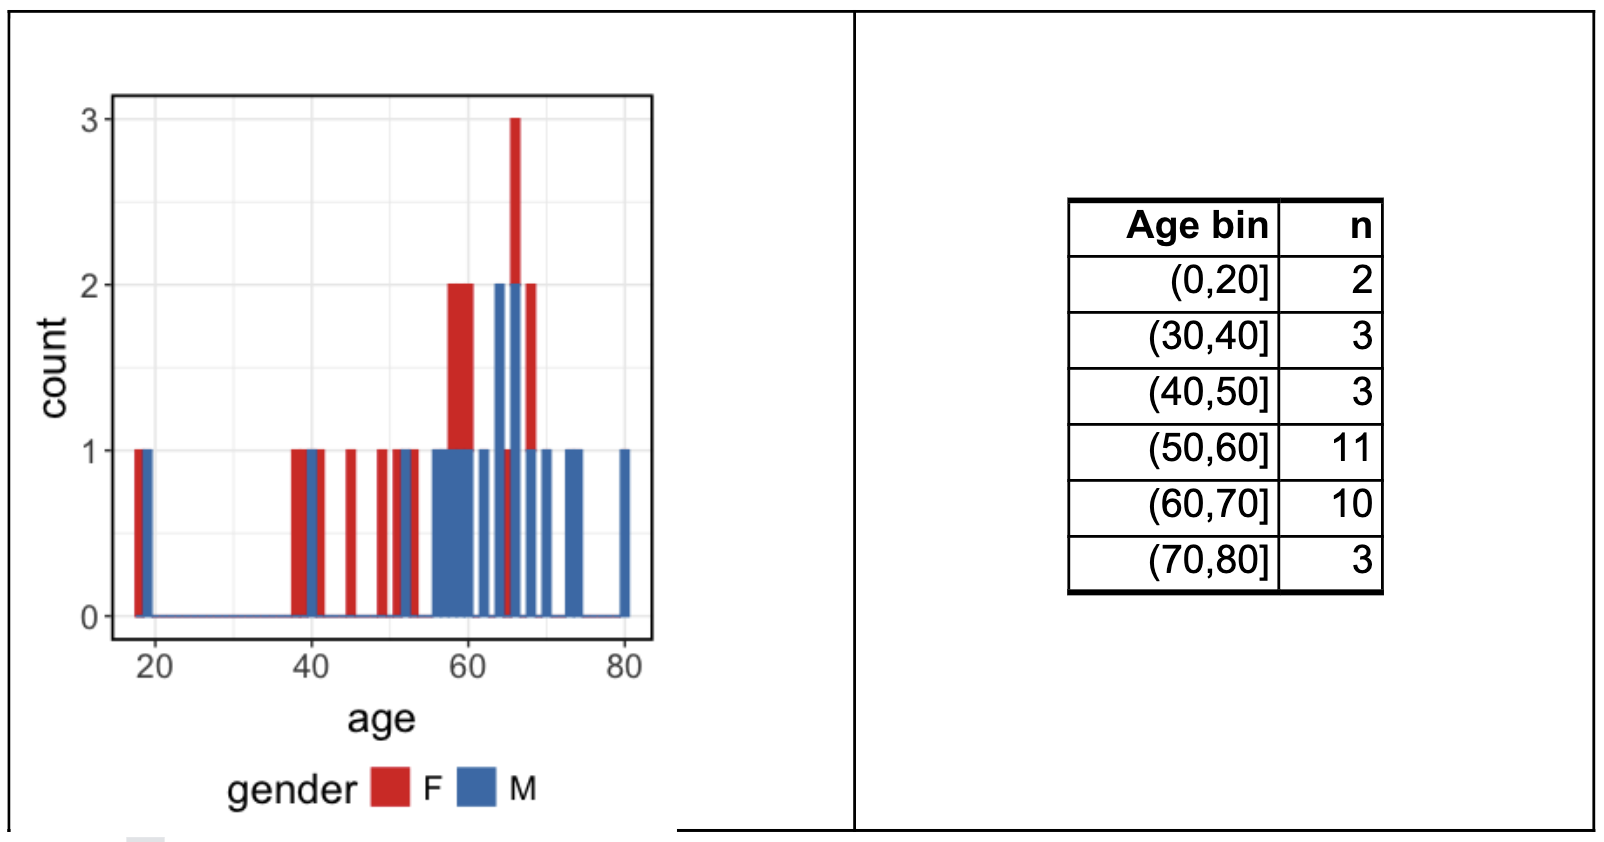
Fig. 7 Figure 14. Distribution of age and gender, and the number of patients in each age bin.
Considering the diagnoses, we observed that male patients had a more varied set of diagnoses than females had although the counts for some of the diagnoses were relatively low. For the age bins, it was clear that the 50-60 year olds dominated a particular set of diagnoses.
Analysis using the AEQUITAS Experimenter
We uploaded this data set to the Experimenter as a custom tabular data set to determine whether bias existed in the data. From the available features in the data, we selected age bin, gender, diagnosis as sensitive variables and the presence/absence feature as target variable. Because the data overview indicated a correlation of 0.87 between gender and the feature engineered variable gxd, we set those as proxies of each other.
The disparate impact for gxd was clear to observe (see Figure 16) for especially Female and coronary artery disease and arterial hypertension. Note that the left-hand panel with the negative diagnoses appears much more balanced. This, however, is due to the data processing strategy to have all other diagnoses not being set for an individual added to the data set and thus artificially inflating and equalizing the number of data points.
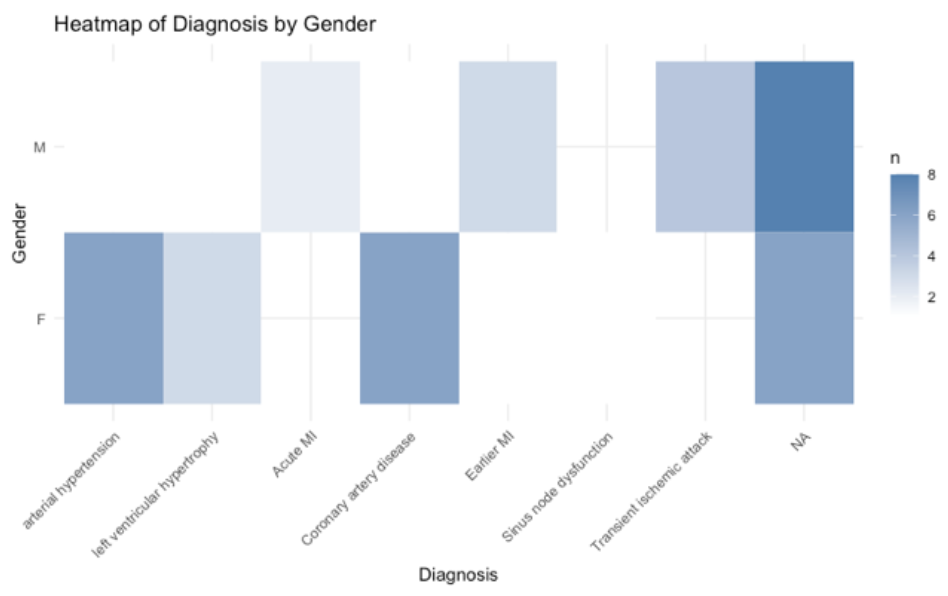
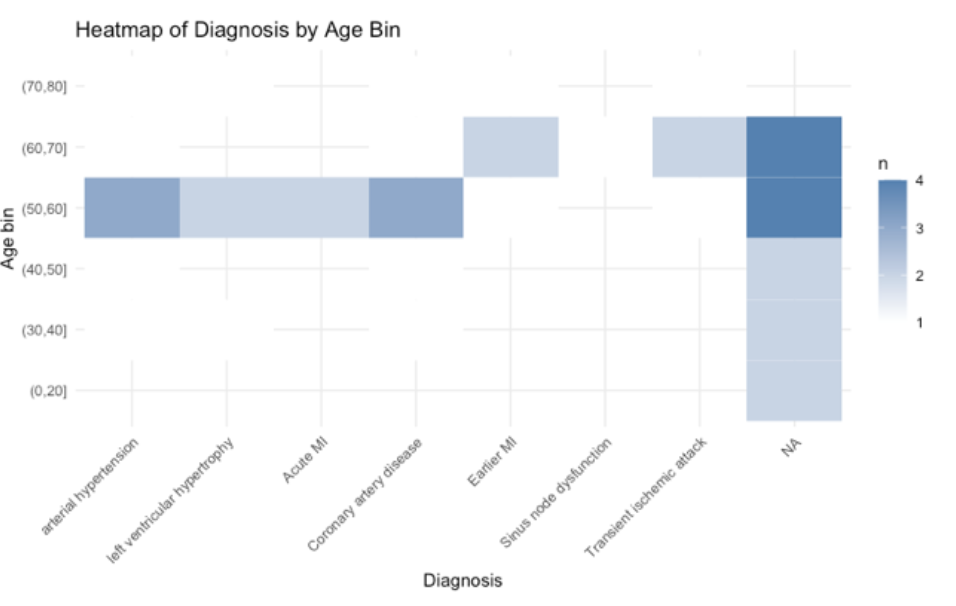
Fig. 8 Figure 15. Heatmaps of the number of occurrences per diagnosis for gender and age. Note that the NA diagnosis represents the considerably sized subgroup of patients for which no formal diagnosis was registered.
Next, we used the Learned Fair Representations technique (5 prototypes, 1% input quality weight, fairness weight 1, and prediction error 50) to mitigate the observed bias. This resulted in a clear increase in the fairness metric as is visible in Figure 17 (top panel). While this fairness improvement comes at a small cost with reduced Accuracy and Precision scores, Recall and the AUC scores, on the other hand, increase a bit (see bottom panels in Figure 17.
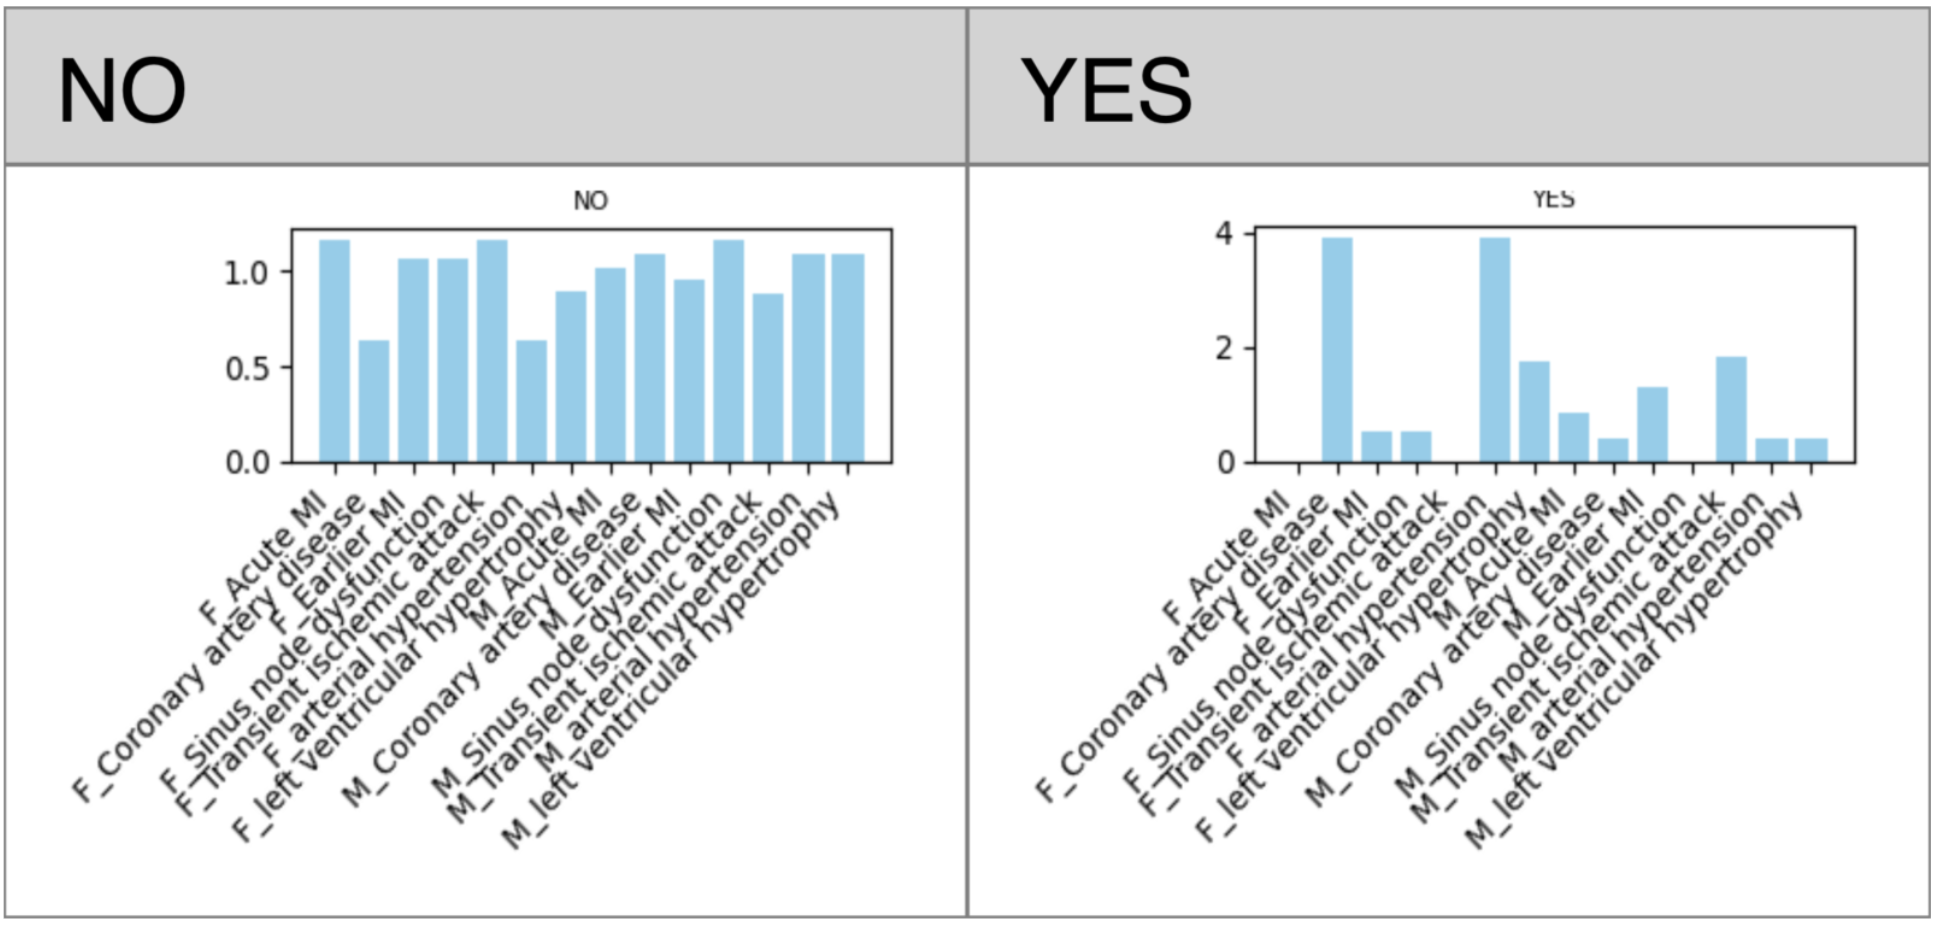
Fig. 9 Figure 16. Disparate impact scores for gender and diagnosis absent (left-hand panel) and present (right-hand panel). Individual diagnoses (x-axis) are prefixed with F or M to indicate gender.
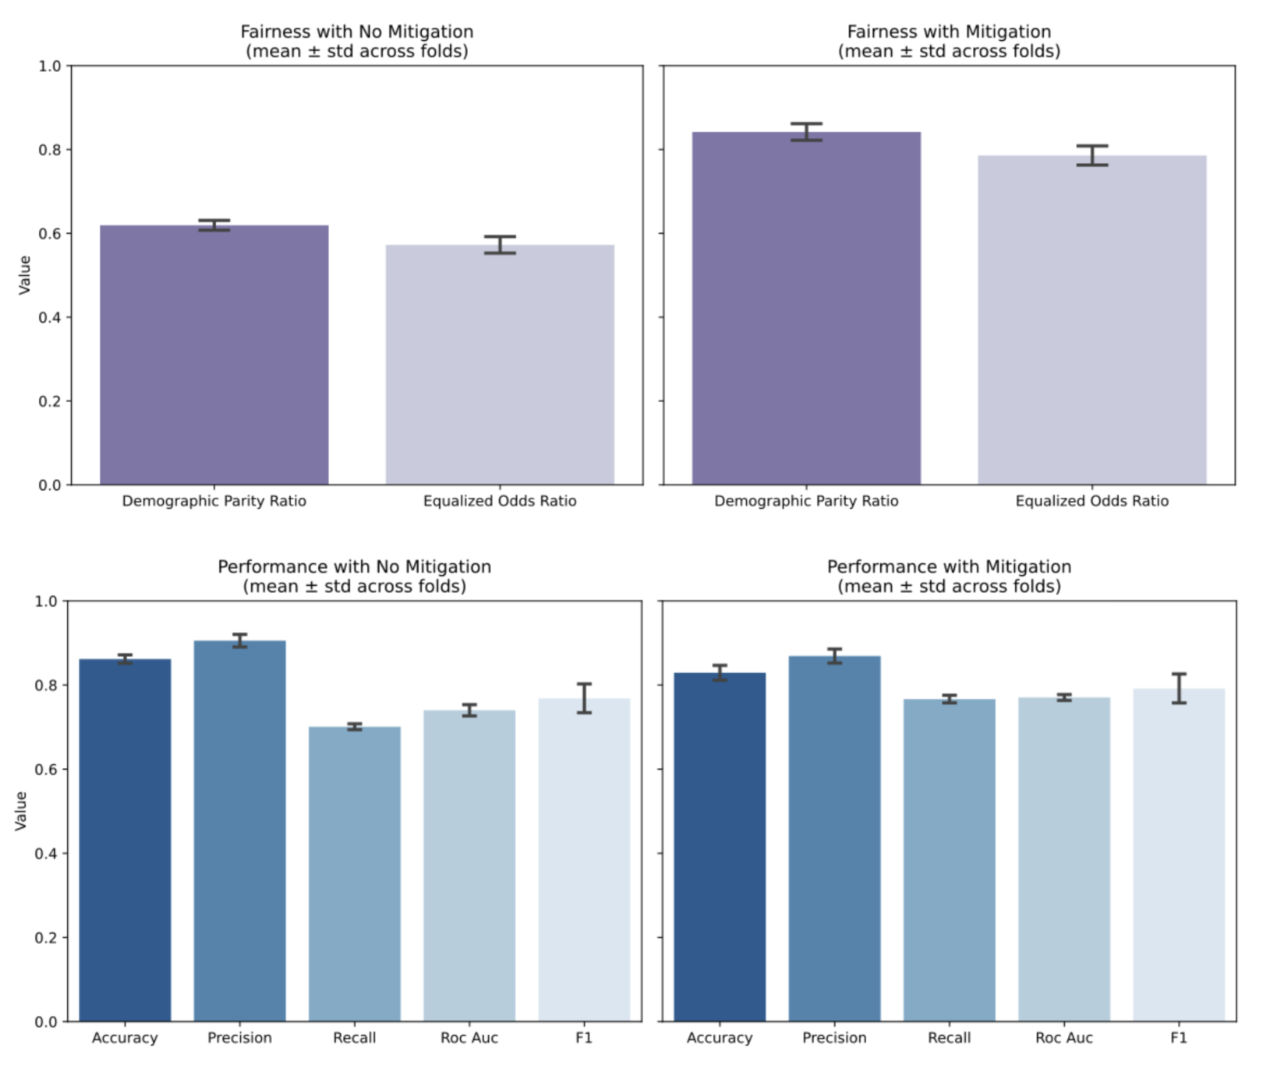
Fig. 10 Figure 17. Comparison of the fairness metric without (left-hand top panel) and after bias mitigation (right-hand top panel) and model performance scores in the bottom panels.
Bias repair using synthetic data
To show that disparate impact can also be addressed using synthetic data, we used the Aequitas synthetic data generator [13] to generate a much more balanced synthetic data set for those data elements with a positive diagnosis (has the symptom/disease). To do so, we use the synthesizer’s multivariate sampler to fit a model to the data and then conditionally sampled 10 rows of data for all combinations of both genders and all diagnoses, recreating the feature engineered gxd variable afterwards. We combined the synthetic data for the positive diagnoses with the data from the negative diagnosis from the original data set into one new file. We then again uploaded these data to calculate disparate impact and followed the same steps as with the first experiment on the original data.
The analysis showed that correlations between the individual features hardly changed. Because Gender and the gxd variable again had a high correlation of .87, we set the two variables as proxies and calculated disparate impact. Figure 18 below now clearly shows that the scores for each class (for both the diagnosis absent, left-hand panel, and present, right-hand panel) revolve around the “ideal” score of 1.
This shows that synthetic data is a complementary method to the more statistical or model-based bias mitigations that are implemented in the Experimenter.
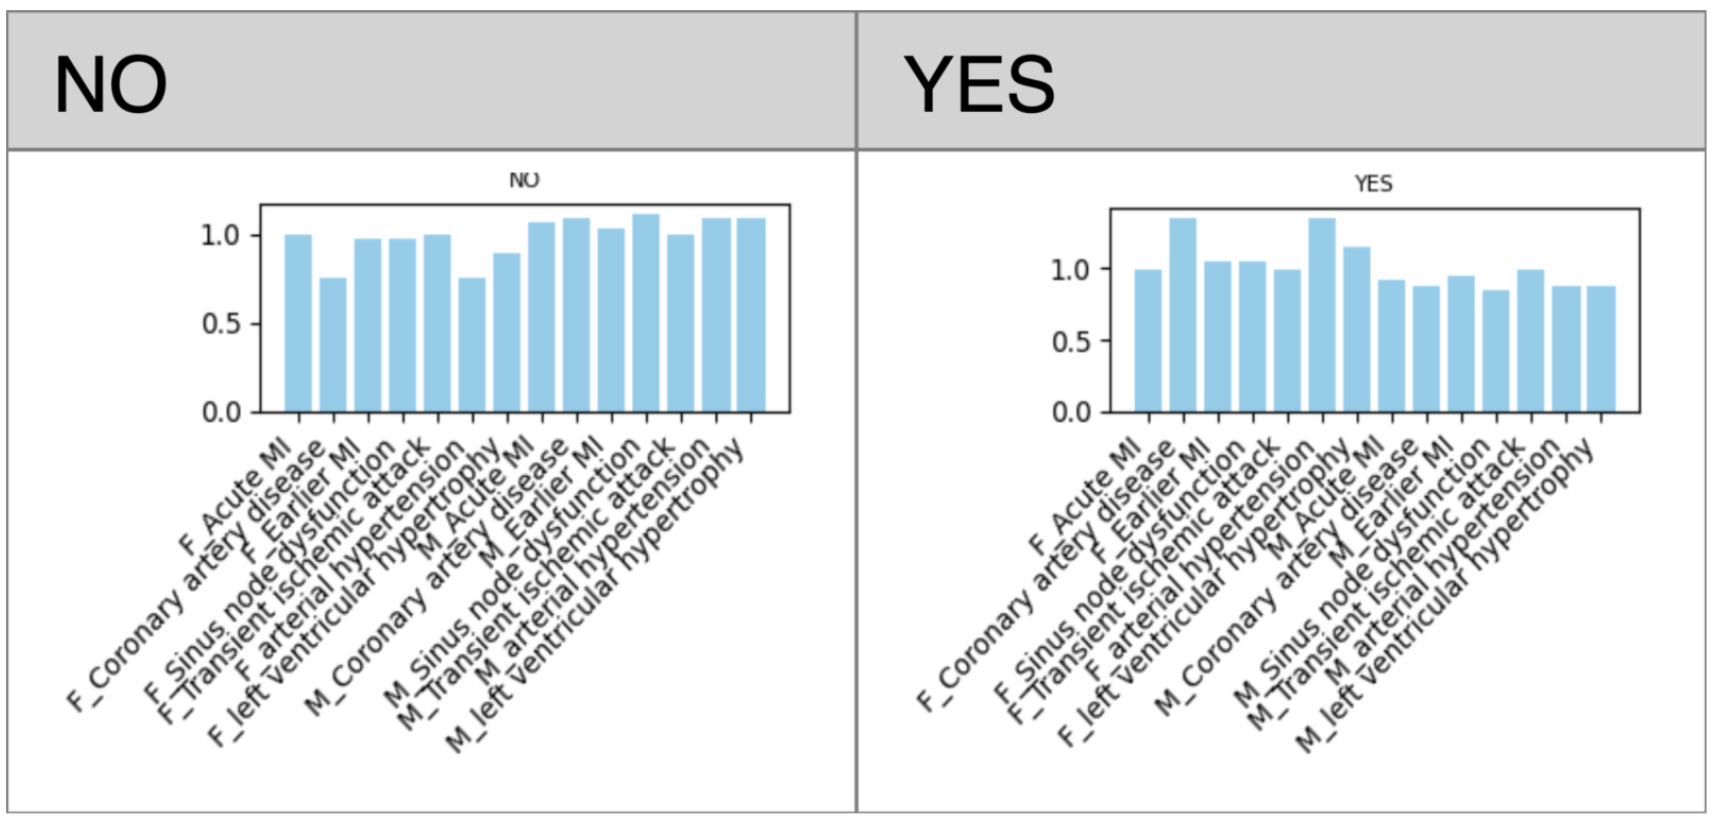
Fig. 11 Figure 18. Disparate impact scores for the synthetic dataset based on the incart database demographic data (sub) set.
Learnings and conclusion
The ECG use case prompted for a tailored use of the AEQUITAS framework and the results presented in the present chapter show that such picking of methodologies is feasible and results in valuable insights. Considering the FbD methodology (see Appendix E.1.5), the purpose component of the FOIM method drew attention to the relevancy of documentation and the need to undergo third-party conformity assessments. Data source analysis highlighted contextual differences due to, for instance, different healthcare operations between nations or regions of the world and that historical bias was not considered running the risk of perpetuating past injustices. Finally, outcome evaluations showed a need for transparency and user agency to ensure that users have clear and understandable information to make informed decisions based on the systems output. Due to the limited availability of public background information, an IFM analysis was not carried out for the present use case. The Experimenter analysis of the toy data set (based on the demographic variables present in the use case’s original data) showed how pre-processing (e.g. through synthetic data) and in-processing bias mitigation techniques can result in similarly reduced bias metrics.
The synthetic ECG (sample) data that have been shared with the consortium show that, while not directly having been informed by the FbD and IFM, different angles to the bias problem can be used to find or create (additional, synthetic) data to train an AI system for monitoring ECG in a, for instance, emergency room.
The classical method to find this data would be to acquire a wealth of ECG traces from a variety of different hospitals and covering a wide range of patient populations. The diversity of patient populations has direct impact on the diversity of ECG traces: from ECGs affected by primary symptoms to those affected by comorbidities. To mitigate possible biases, patient (sub) populations need to be accurately represented: on the one hand the population prevalence needs to be considered but also the need of the AI algorithm to have sufficient samples to properly learn the properties of low prevalence populations. Of course, also ECGs from healthy persons can be considered as part of such a data set. Training an AI on such a data set ensures that it can accurately flag ECGs (online in the ER or offline during later analysis) that can be considered abnormal.
If this approach does not lead to sufficient data or requires supplementing the data of particular subgroups, might be inclined to copy-paste ECG traces of which more exemplars are needed. However, these copied ECGs do not bring in the required variation for AI to train on, even if the copied ECGs would be massaged to be different to their original.
Another approach revolves around considering that an ECG trace is a “sum” of a (series of) true, proper PQRST complex(es) on top of which certain types and amounts of noise are added. Part of that noise can come from factors like comorbidities or specifics of particular patient (sub) populations (for instance like reduced signal strength in individuals with obesity). Additional noise sources can be measurement errors due to equipment failure or defective sensors. Linked to this noise source are ECG artifacts introduced due to movement or simply wandering ECG measurements due to defective electrodes. The key insight in this approach is that these noise sources can be simulated using anything from relatively simple (statistical) noise generators upward to complex neural networks for generating noisy patterns and that these noise data can then be added on top of a normal ECG complex to create a new version that an AI algorithm should also recognize as ECG.
This approach sidesteps bias by focusing on the breadth and depth of ECG signals that a monitor may come across (for a normal/abnormal indication) in a way that is independent of demographics, symptoms, and comorbidities and potential bias that may arise from these factors alone or in combination. In this way, even with only a few noise generators and a set of 12 leads that can or cannot be noisy possibly with different types of noise across leads, a very large data base of ECG signals can be generated that can then be concatenated into ECG time series that represent the breadth and depth of ECG traces observed in real life ER context. An AI can then be trained on this data to monitor ECGs over time and raise an alarm if the signals deviate from the norm to such a degree that a deterioration of the patient is likely.
The analysis of the present use case using various tools of the AEQUITAS framework shows that the tooling is effective even in scenarios where limited information or limited data is available. Due to confidentiality requirements, we could not glean new information, for instance around previously unobserved bias(es) for this use case of ECG in the hospital. The FbD analysis, however, did highlight a potential missed bias in a use case similar to the present. Moreover, building on the learnings and insights presented in the preceding chapters, we are sure that a deeper, Philips internal, analysis of the use case using the AEQUITAS framework methodologies will demonstrate that our method of addressing bias using synthetic ECGs is effective in reducing or preventing bias in ECG monitoring.
Appendix
See the Appendix E for the full report of the workshop.
References